Timeline View
The Timeline is your daily activity log, showing sessions, app usage, and events in an hour-by-hour grid view.
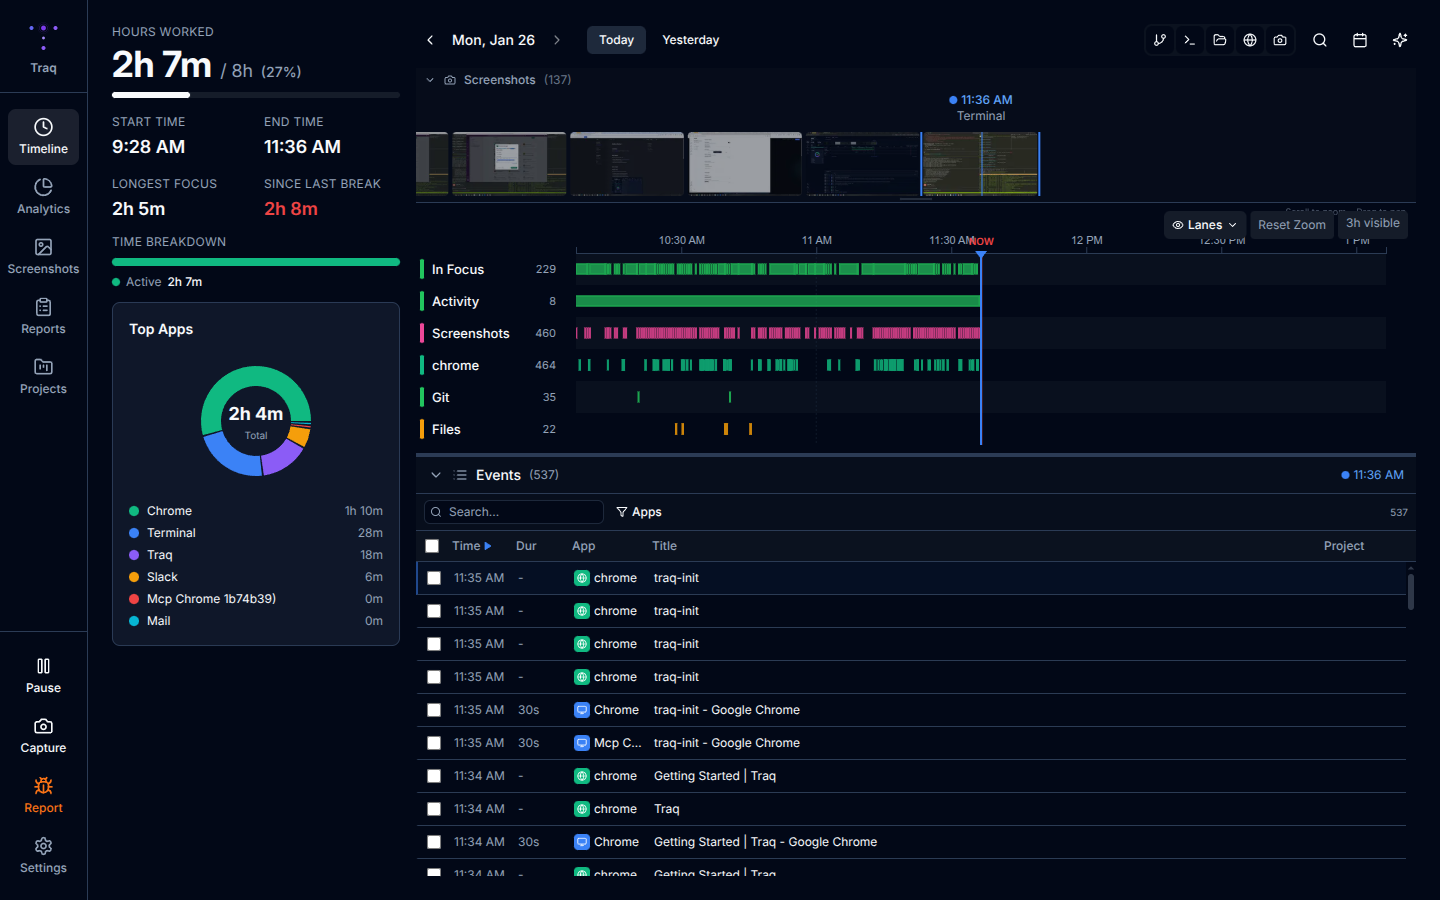
Daily Summary
The left sidebar displays key metrics for the selected day:
Hours Worked
- Total active time with progress bar (based on 8-hour workday)
- Start time and end time of your day
Focus Metrics
- Longest Focus - Your longest uninterrupted focus session
- Since Last Break - Time elapsed since your last break (color-coded):
- 🟢 Green: < 30 min (just had a break)
- 🟡 Yellow: 30-60 min (break coming up)
- 🟠 Orange: 60-90 min (should break soon)
- 🔴 Red: > 90 min (overdue for a break)
Category Breakdown
Visual bar showing time distribution across categories:
- Focus (green) - Coding, writing, creative work
- Meetings (red) - Video calls, meeting apps
- Comms (purple) - Chat, email, messaging
- Other (gray) - Everything else
Top Apps
Donut chart showing your most-used applications with time breakdowns.
Calendar Widget
Navigate between days using the calendar:
- Darker cells = more activity
- Click any day to view that day's activity
- Navigate between months using the arrows
- "Today" button returns to current day
Timeline Grid
The main grid shows activity organized by hour:
AI Summary Column
When AI summaries are enabled, each session shows:
- Natural language description of what you were working on
- Confidence indicator and relevant tags
- Expandable details with full explanation
App Columns
Your active applications are displayed as colored blocks:
- Block height represents duration
- Hover for window title and exact times
- Category-based coloring for quick scanning
Screenshot Column
Thumbnail previews of captured screenshots:
- Click to view full-size in lightbox
- Navigate between screenshots with arrow keys
Activity Events
Additional tracked events appear in dedicated columns:
- Git - Commits with message, repo, and branch
- Shell - Terminal commands with exit codes
- Files - File system changes (downloads, project files)
- Browser - Web page visits with duration
AFK Blocks
Gray blocks indicate away-from-keyboard periods:
- Shows duration and trigger type (idle timeout, system sleep)
- Helps identify break patterns
Navigation Tips
- Use the date picker to jump to a specific date
- Previous/Next arrows move between days
- Click column headers to expand/collapse sections